Texas A&M is a state entity, governing 11 universities and 8 specific state agencies, all overseen by a Board of Regents appointed by the Governor of Texas.
Rather than preparing our Texas Families for Jobs of the Future, they have been hiring nonimmigrant workers on visas like the H-1B.
Is it any wonder why they no longer teach Texas Values?
The Dallas Express has a interesting news article about this that is out today at: https://dallasexpress.com/education/texas-ams-h-1b-spending-sparks-debate-over-jobs-and-transparency/
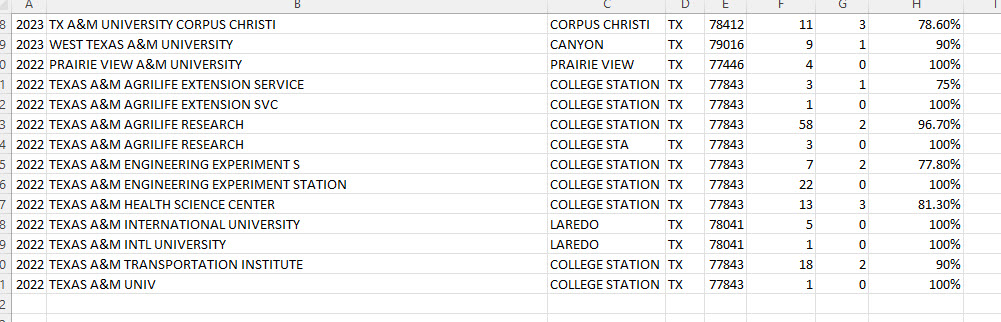
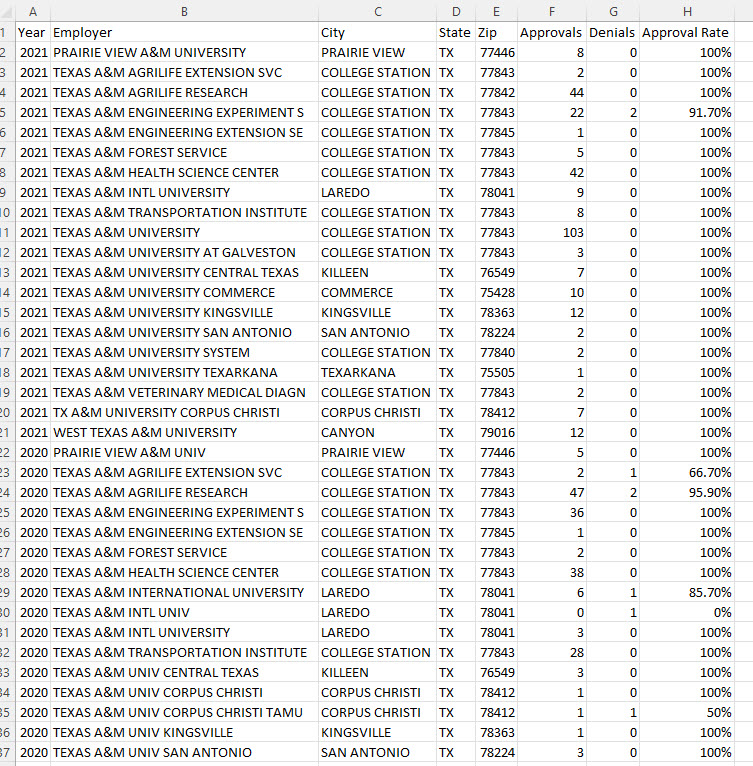
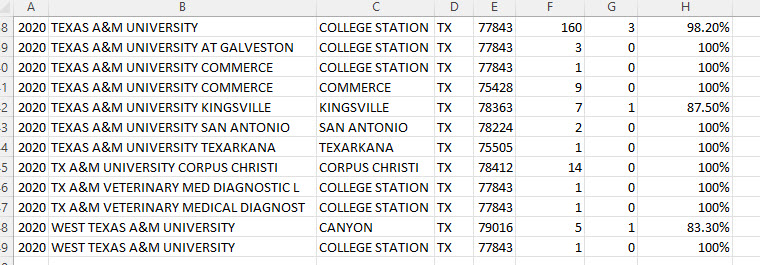
According to the U.S. Citizenship and Immigration Services H-1B Data Hub, 659 H-1B beneficiaries have been approved at Texas A&M since 2020 through September 30, 2025, the most recent period available. Across the entire Texas A&M System — which includes entities such as AgriLife Extension and Texas A&M University at Galveston — the number of approved H-1B workers exceeds 1,400, according to the data hub.
Nationally, the majority of those visas go to workers from India and China. Federal data show 72% of H-1B visas are awarded to workers from India and about 12% to workers from China, according to USCIS figures.
The privately operated H-1B Salary Database, which catalogs labor condition applications filed with the U.S. Department of Labor, one of the first steps in the H-1B process, shows that the overwhelming majority of Texas A&M’s filings in 2025 were for lower-level instructional roles.
They referred to the USCIS H-1B HUB for approved H-1B’s and h1bdata.info which I refuse to use because the data is edited, so I turned to my own site at guestworkervisas.com where I know the data is unedited.
If I was the Dallas Express, I would recommend they either use my system in the future or download the source data from USCIS so that they can get more accurate totals.
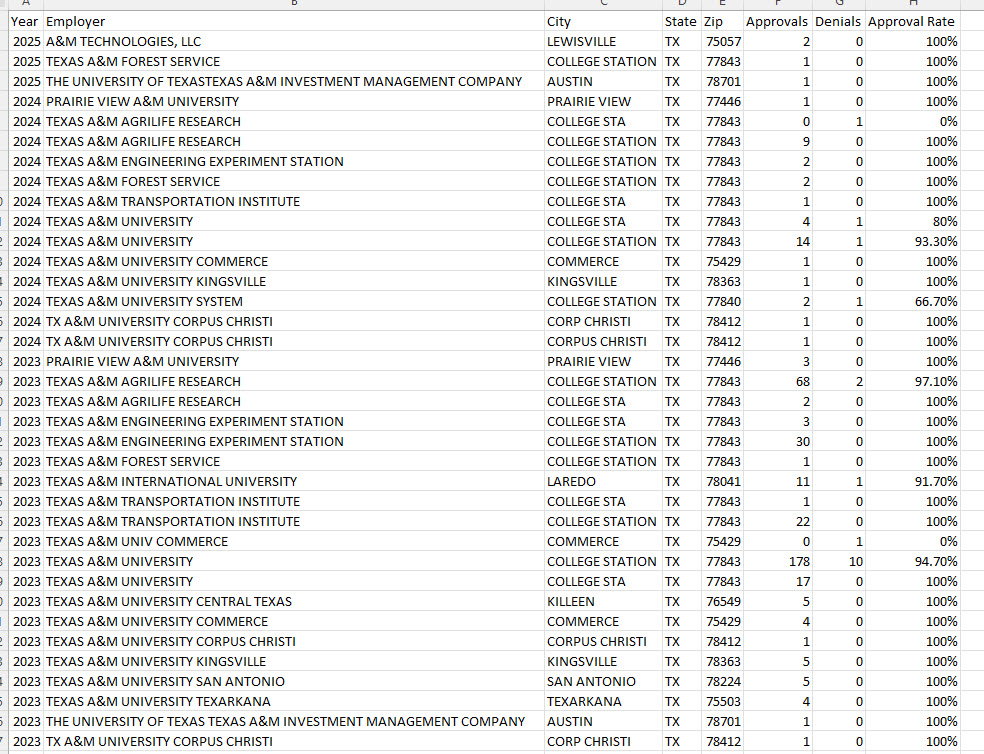
While there is a possibility that there may be an additional company in the data that had A&M in its name, I do not have the staff that the Dallas Express has so I felt it was better to let you judge who is using Texas Taxpayer Money to Deprive Texans of a future.
You can view the data yourself at: https://guestworkervisas.com/h1b-data-browser.html
If we turn to the H-1B LCA applications data, we find a similar discrepancy in the number of applications and the job titles are not trivial low paying positions.
I will show one year (2025) summarized here.
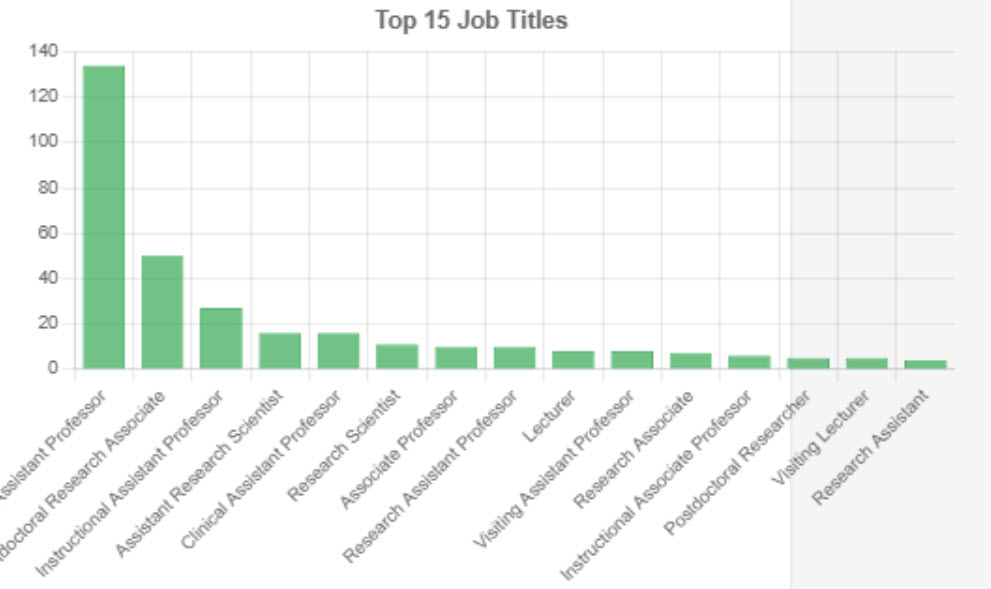
I will bet our Texas Families that want to be teaching the kids of tomorrow would love being able to compete for these jobs.
You can browse the data yourself at: https://guestworkervisas.com/browseh1b.php
Keep in mind that Dallas Express cited multiple years from 2020 till present day.
While I haven’t totaled the data up myself, I believe you will find that it is much more than $3,252,339.17 in wages, unless of course A&M was citing actual payroll data as collected by their paycheck processing company.
Ask yourself this.
If all Texas State Agencies are using Foreign Workers rather than American Workers, how does that help provide a better future for Americans in America?
And if that money that they operate on is our tax money, do we have the right to demand that no taxpayer money be used to hire anyone who does not have a 100% american workforce?
As many of you know, I am campaigning to be the next Senator from the Great State of Texas, and this is a prime example of why I am standing up for the future of Texans.
You can find more information on me at https://vbsenate.com/