Too many people know that they cannot find good paying jobs.
It doesn’t matter if they graduated with honors from our best STEM colleges.
It doesn’t matter if they have decades of experience, knowledge and wisdom in our most challenging STEM jobs.
But they can’t understand why which is what this site has been developed to help with.
It takes years, if not decades to understand all the pieces.
We will help you understand why here.
This first issue I will try and give a high level overview.
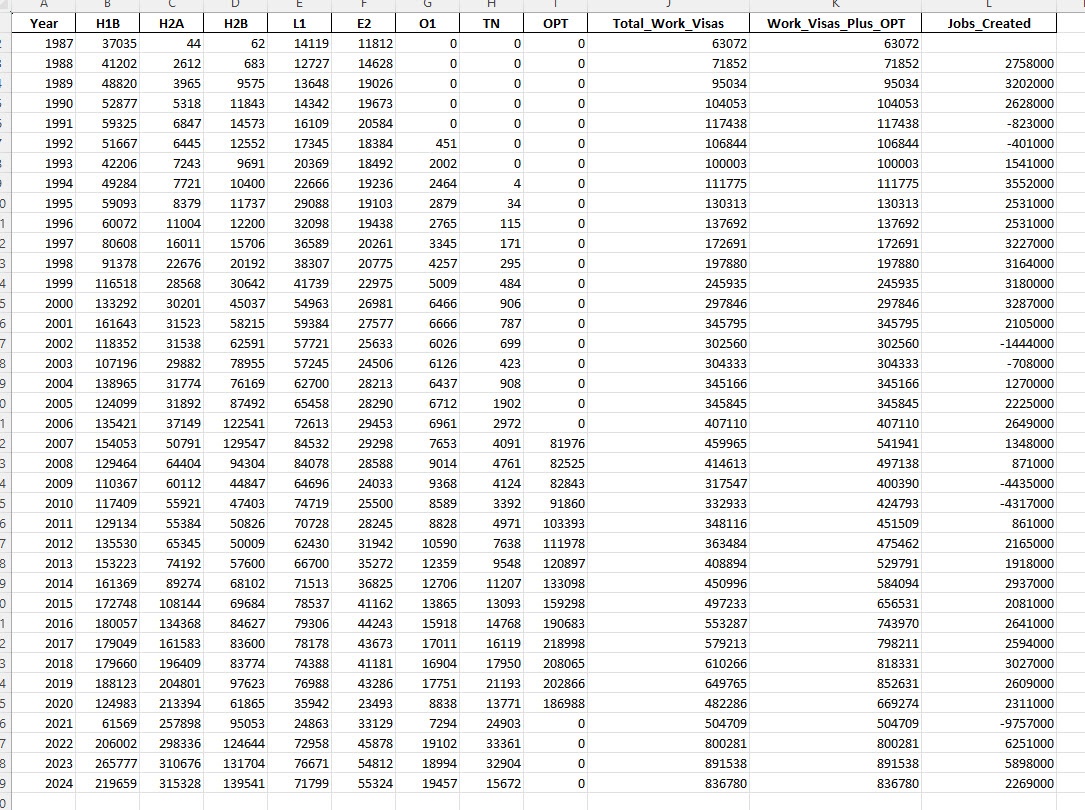
- Between 1939 and now we have historically created 1.5 million jobs per year on average. In 2025 we created 584,000 which was far below average.
- We issued nearly 11 million nonimmigrant visas in 2024 with about 836,780 being work visas to take jobs in America from Americans like yourself.
- These foreign born workers are typically hired before Americans and as of 24 Jan 2026, the percentages were:
- Americans get 55% of all jobs created since Jan 2007
- Foreign Workers get 45% of all jobs created since Jan 2007
- This report is typically released on the first friday of the month with the Employment Situation Report.
- It is called Table A-7.
- I simply collect the Employed data for each month for both the Foreign Born and the Native Born worker.
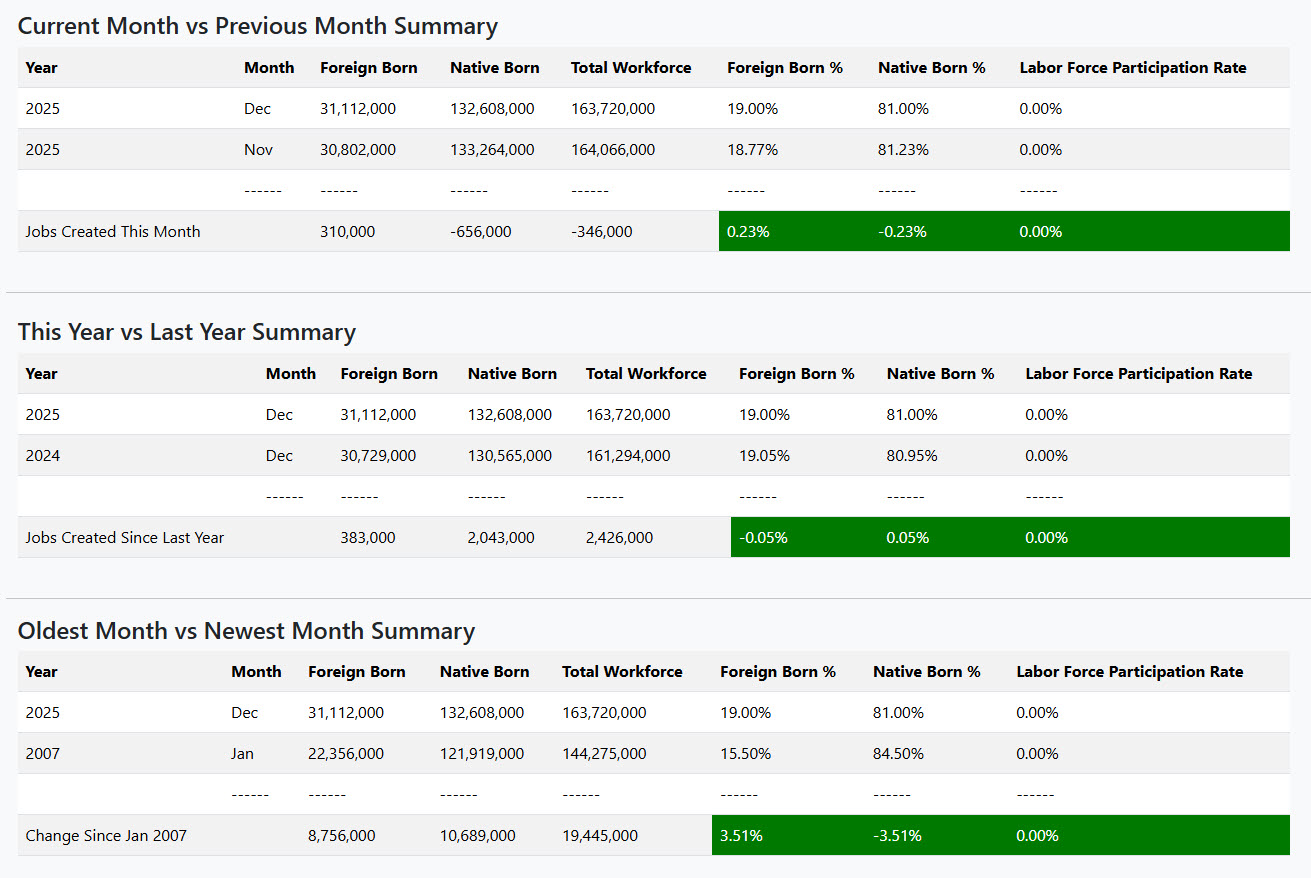
Note: You will notice the number of jobs created as shown on the Employment Situation Report each month is different than the number of jobs that is calculated each month where the White House will show you that they created 2,043,000 jobs for native born americans and 383,000 jobs for foreign born workers. As an example for the month of Dec 2025, the employment situation report shows that we created 50,000 jobs, not 2,043,000 jobs.
As an example, I will show you the Dec 2025 results of table A-7. I have it automatically generate the following 3 views using the same exact data so that you can see what actually is happening:
- Current Month vs Previous Month Summary
- This Year vs Last Year Summary
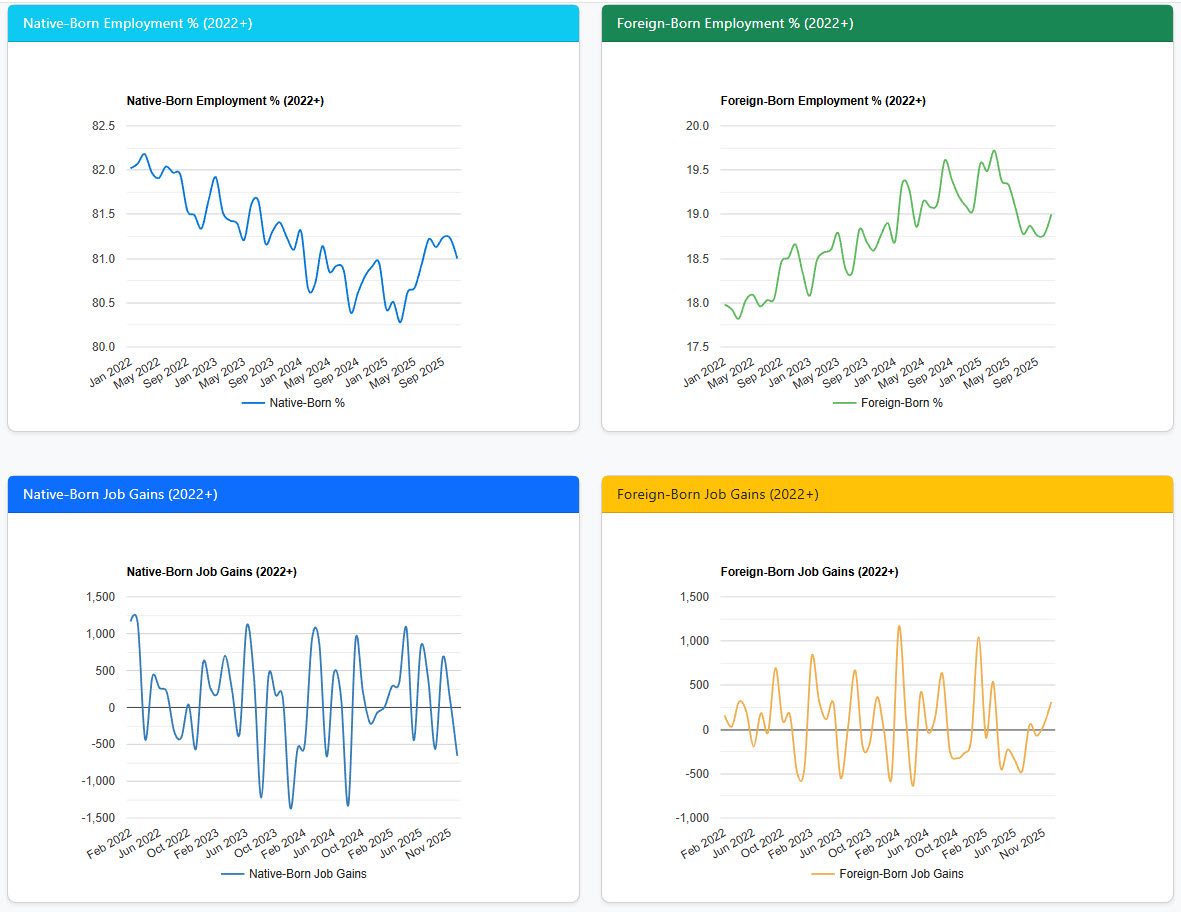
- Oldest Month vs Newest Month Summary (this is done to eliminate the noise in the monthly fluctuations.
The noise I refer to can be seen in these 4 charts that are different views of the same data.
With this knowledge you can easily figure out what actually happened when the montly Employment Situation Report is issued, and this will help you to understand why you can’t find good paying jobs in America. It is updated monthly as the Presidential Job Creation Scorecard.
Influencers.
Let’s go!!! Watch the video, use the tool and get to work!
Thank you @SaraGonzalesTX for getting the word out! https://t.co/6Ny4LtkxRF
— N. Lee Plumb for TX-2 (@PlumbNick) January 24, 2026
I was dropped this info last night: pic.twitter.com/GMjQGj2O9M
— Amanda Goodall (@thejobchick) January 23, 2026
While Americans are laid off, Washington keeps expanding work permits for foreign spouses and students.
This is how U.S. jobs are being replaced.. legally and silently.
Full report ⬇️https://t.co/AMKnYZMznT
— Alb (@amandalouise416) January 23, 2026
The Bus Stop
Cold morning.
The kind where you hold your coffee to keep your hands warm and then it's too cold to drink
There really is an America First movement.
But it isn’t in Washington.
More than 25,000 of us gather here on X to discuss it nearly every day.
It’s also… pic.twitter.com/0QeC1XXVyc
— Chief_Engineer (@ChiefEngineerCE) January 24, 2026